Contents
|
STG top Introduction How to make STG STG format
Optimal schedules Links |
The Standard Task Graph Set Archive now consists of task graphs without communication costs (i.e. 0 communication costs) and Task graphs with communication costs.
Task Graphs Without Communication Costs
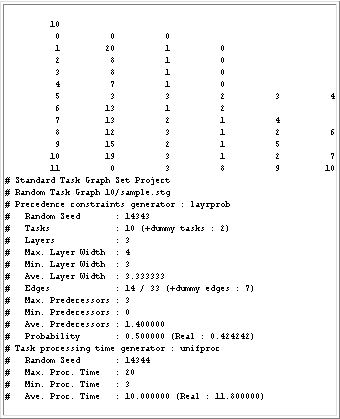
Figure 4 : A task graph with 10 tasks
Figure 4 shows an example task graph file of the STG. It consists of a ``task graph part'' and an ``information part''. The task graph part is the matrix of numbers at the top. The information part begins with ``#'' in the first column.
1) Task graph part- The field for each number is 11 characters wide.
First line- The "10" represents the number of tasks.
Second line- This line holds the information of the entry dummy node (T0). The first ``0'' represents task number 0. The second ``0'' means that the processing time for task 0 is zero. The third ``0'' means that task 0 has no predecessors.
Third line- The ``1'' represents task number 1. The ``20'' means that the processing time for task 1 is 20[u.t.]. The second ``1'' means that task 1 has one predecessor. The ``0'' means that the predecessor of task 1 is task 0.
Seventh line- The ``5'' represents task number 5. The ``3'' means that the processing time for task 5 is 3[u.t.]. The second ``3'' means that task 5 has three predecessors. The ``2 3 4'' mean that the predecessors of task 5 are tasks 2, 3, and 4.
Other lines- They represent the information for each task the same as above.
Last line- This line holds the information of the exit dummy node having 0[u.t.] processing time.
2) Information part- The information part is composed of four different parts:
a common part (task graph file name, etc.),
precedence constraints form,
task processing time,
and other information such as critical path length and
task graph parallelism.
A) Common information part- The second line shows that this task graph belongs to the ``random'' or ``application'' section and that the name of the graph is ``10/sample.stg'', which means that this graph is ``sample.stg'' in directory ``10'' of the ``Standard Task Graph Set'' archive.
B) Precedence constraints form information part- This part shows the precedence constraints generation method
(``sameprob'', ``samepred'',
``layrprob'', or ``layrpred'')
and the name of the actual application program.
The following lines give statistical information for the task graph:
number of tasks, edges, and predecessors, maximum and minimum
number of predecessors, and so on.
The ``Probability'' line shows the edge connection probability of all
connectable edges.
In Figure 4,
# Probability : 0.500000 (Real : 0.424242)
shows that the edge connection probability set in the random task graph generator program was 0.500000 and that the real edge connection probability of the generated task graph was 0.424242.
C) Task processing time information part- This part shows that the task processing time generation method
(``unifproc'', ``expoproc'',
or ``normproc'') and the name of the actual application program.
The following lines give statistical information on the task processing time:
random seed and maximum, minimum, and average task processing times.
In Figure 4,
# Ave. Proc. Time : 10.000000 (Real : 11.800000)
shows that the average task processing time set in the random task processing time generator program was 10.000000 and that the real average task processing time of the generated task graph was 11.800000.
D) Other information part- This part gives other information: critical path length and parallelism.
In Figure 4,
# CP Length : 52
means that the critical path length (longest path from the exit node to the entry node) is 52[u.t.].
In Figure 4,# Parallelism : 2.269231
means that the parallelism of the task graph is 2.269231, (sum of all task processing times)/(critical path length).
Task Graphs with Nonzero Communication Costs
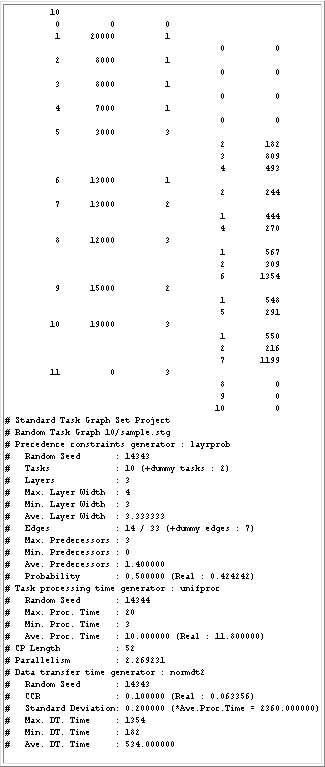
Figure 5 : A task graph with 10 tasks (with communication costs)
Figure 5 shows an example task graph file of the STG_dt. It also consists of a ``task graph part'' and an ``information part''. The task graph part is the matrix of numbers at the top. The information part begins with ``#'' in the first column.
1) Task graph part- The field for each number is 11 characters wide.
First line- The "10" represents the number of tasks.
Second line- This line holds the information of the entry dummy node (T0). The first ``0'' represents task number 0. The second ``0'' means that the processing time for task 0 is zero. The third ``0'' means that task 0 has no predecessors.
Third line- The ``1'' represents task number 1. The ``20000'' means that the processing time for task 1 is 20000[u.t.]. The second ``1'' means that task 1 has one predecessor.
Fourth line- The ``0'' means that the predecessor of task 1 is task 0. The second ``0'' means that the communication cost when the predecessor (task 0) and this task (task 1) are assigned to different processor is 0[u.t.].
11th line- The ``5'' represents task number 5. The ``3000'' means that the processing time for task 5 is 3000[u.t.]. The second ``3'' means that task 5 has three predecessors.
12th line- The ``2'' means that the first predecessor of task 5 is task 2. The ``182'' means that the communication cost from task 2 to task 5 is 182[u.t.].
13th line- The ``3'' means that the second predecessor of task 5 is task 3. The ``809'' means that the communication cost from task 3 to task 5 is 809[u.t.].
14th line- The ``4'' means that the third predecessor of task 5 is task 4. The ``493'' means that the communication cost from task 4 to task 5 is 493[u.t.].
Other lines- They represent the information for each task the same as above.
2) Information part- The information part is composed of five different parts:
a common part (task graph file name, etc.),
precedence constraints form,
task processing time,
other information such as critical path length and
task graph parallelism, and communication costs.
A) Common information part
B) Precedence constraints form information part
C) Task processing time information part
D) Other information part- These parts have the same meanings as that of ``task graphs without communication costs''.
E) Communication costs information part- This part shows that the communication costs generation method or the name of the actual application program. The following lines give statistical information on the task processing time: random seed, CCR (Communication-to-Computation Ratio) and maximum, minimum, and average communication costs, where CCR = [average communication cost for each task] / [average computation cost].
|
|
|
|